Data
This graph shows the number of Loggerhead turtles that are emerging to their nests.
All of this data shows a gradual decline in numbers of Loggerhead turtles then a slight raise. Some of the graphs then show a further drop.
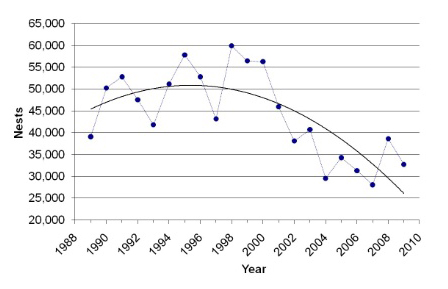
This graph shows the decline of nests from 1988- 2010.
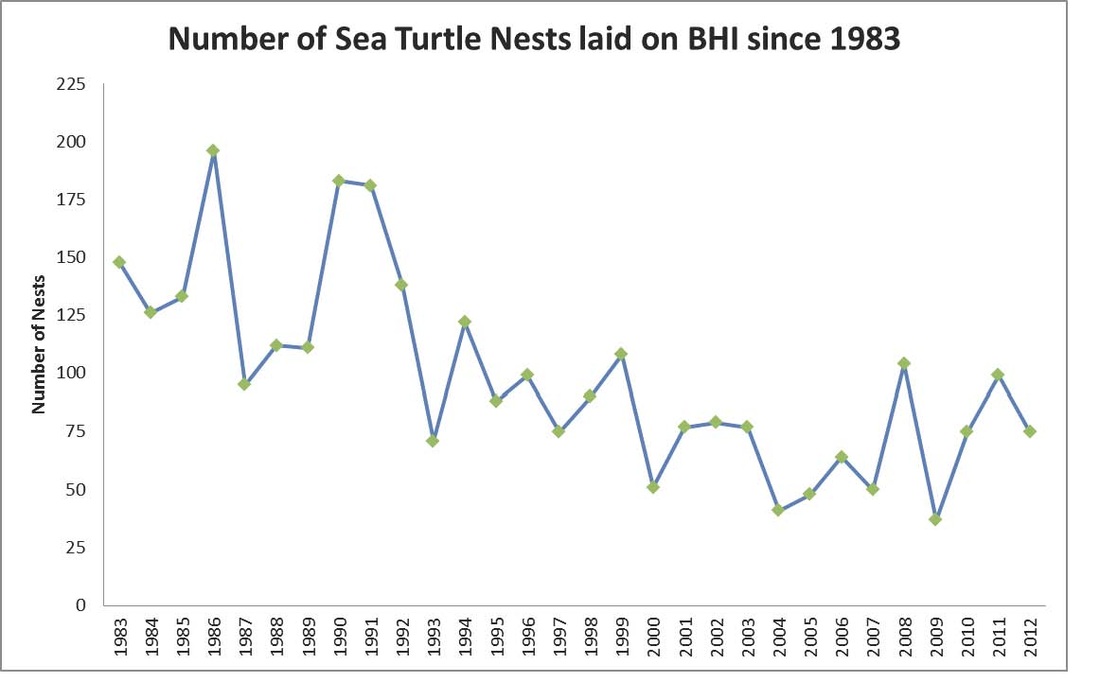
This graph shows the number of Sea Turtles nests laid on BHI since 1983-2012.
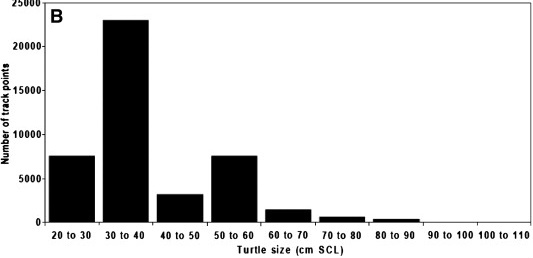
This graph shows the number of track points and the turtle size.
